Oilseed rape production in the EU has not been so low since the EU the EU expanded to 27 Member States. The introduction of Croatia in 2013 had minimal impact on the OSR supply and demand tables, but Bulgaria and particularly Romania, which joined in 2007, account for about as much production as the UK does. The crop this year is thought (for example by Coceral) to be about 12% to 13% lower than last year, and as much as 29% lower than the highest production year of 2014. In fact, since then, four out of the five years have incurred declines in OSR crop size.
This means that this year, the EU (including the UK in this description) will be importing oilseed rape from elsewhere. Some have suggested 6 million tonnes of will be required. At the same time, regulations on importing biodiesel produced from palm oil is becoming more expensive with duties rising. Additionally, the rise of crude oil prices following the attacks on Saudi refineries have also led to rises in vegetable oil markets. These factors have come together to support oilseed rape prices in recent weeks on European markets.
In the meantime, Sterling has gaining strength by 5% against the Euro in the light of rising expectations of a Brexit deal since early August. This has wiped out any gains in the UK OSR markets. This (relatively modest) currency shift demonstrates just how dominant the value of the Pound is on agricultural prices. We have no influence on the value of Sterling and minimal ability to predict accurately.
Taking this logic a little further, it follows that as soon as a decision on the type of Brexit is reached, whether Deal, No Deal or even no-Brexit, the impact on the value of our currency will almost inevitably be instant and dramatic; probably far more than 5% in either direction, depending on outcome. In the short term, the profitability of cereal farming post Brexit-decision will be led by currency shifts. Any other factors might be dwarfed by this one thing.
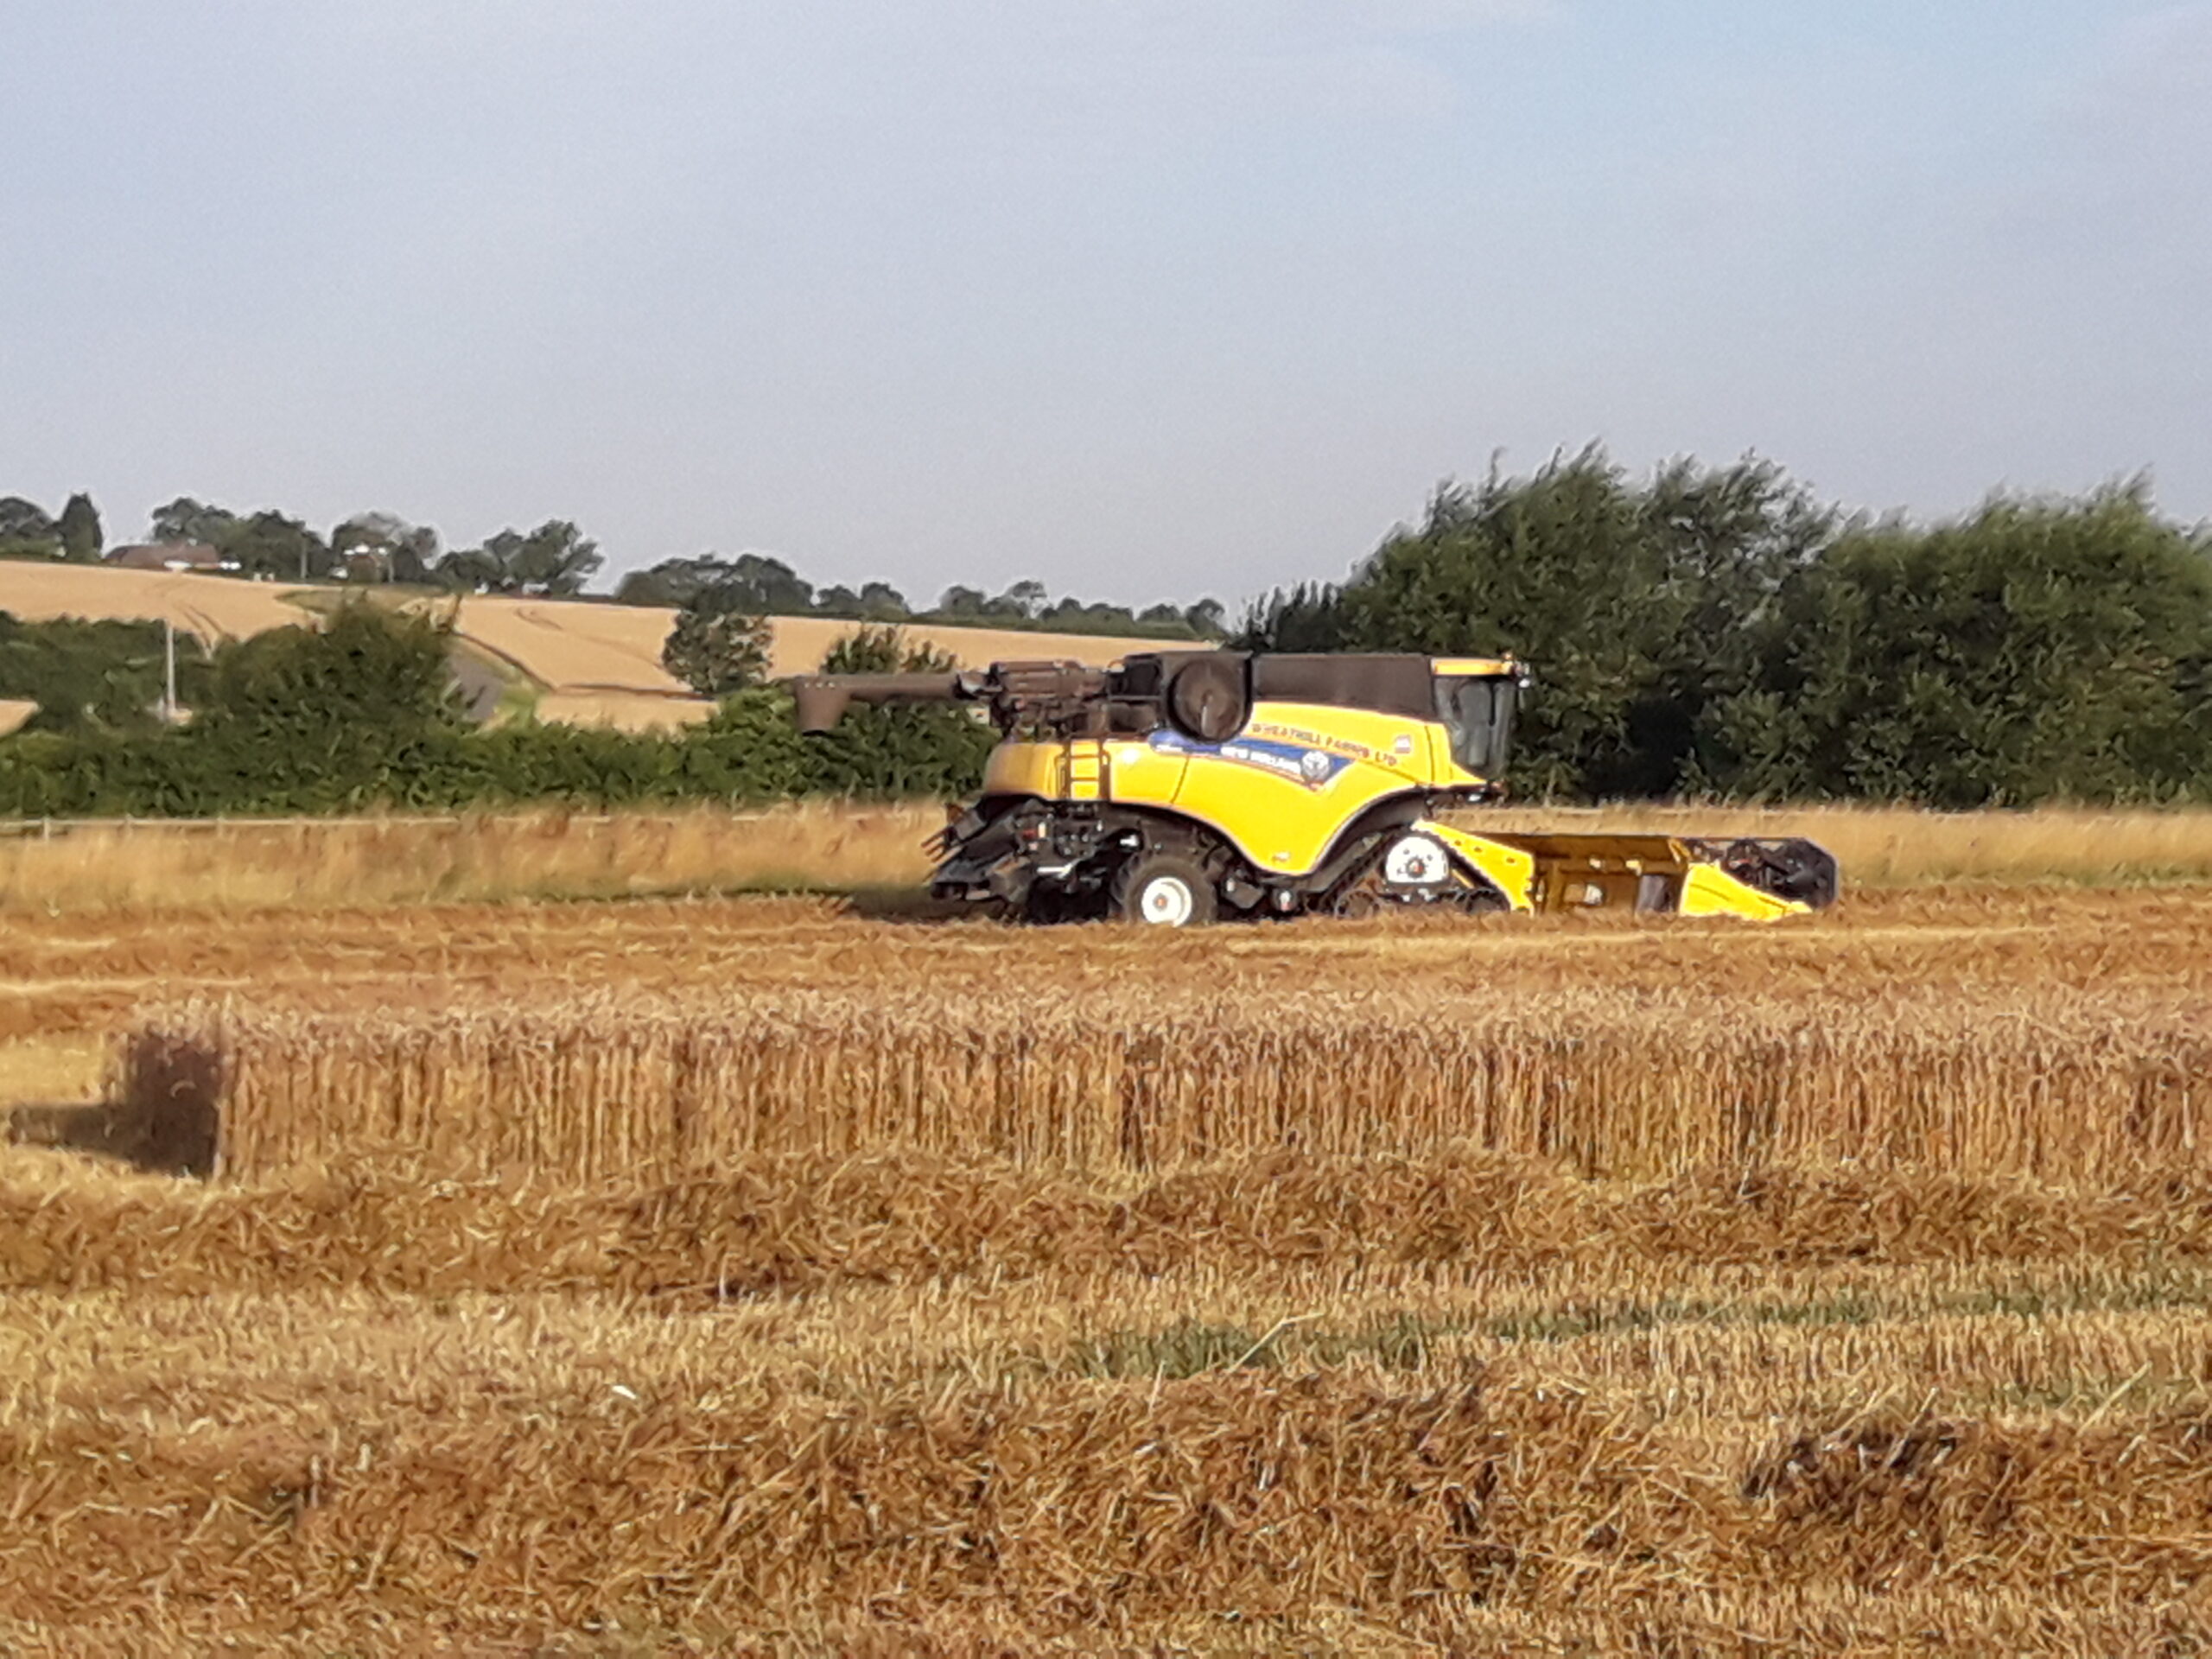
Exporters have been working round the clock to export as much wheat and barley from the UK’s exportable surplus since harvest. Their deadline is 31st October as they do not know what the tariff rates will be after then. Conveniently, there has been considerable buying interest from many of the large cereal buyers, mainly in North Africa including Algeria, Tunisia and Egypt. These countries don’t buy from the UK, but they have occupied other exporters’ minds whilst UK traders have focused on our traditional Iberian markets. This has helped UK grain prices to hold up, in the face of stronger Pound (see above). Yet the EU wheat crop is considerably higher than last year and the US cereals prices (especially maize) have been falling this month. The urgency of exporters to get stocks off farms and onto boats has supported prices.
Bean prices are also holding up well. The urgency to export the (considerable) surplus is smaller, both as much of the bean export goes outside the EU anyway, and also as the tariff rate to the EU is far smaller. In any case, the trade has struggled this year to find much that is of food grade, most ending up in feed bins.