The areas of wheat, winter barley and oats look set to rise for the 2019 harvest. In contrast, the OSR, spring barley and other break crop areas are anticipated to fall compared 2018. These findings come from the AHDB Cereals and Oilseeds annual Early Bird Survey, undertaken for them by The Andersons Centre assisted by the Association of Independent Crop Consultants (AICC) and other agronomists. The provisional results have been used to extrapolate from the 2018 UK June Survey to produce forecast crop areas for the 2019 UK harvest; these are outlined in the table below.
| Early Bird Survey (EBS) – Provisional Results
Estimates of GB Crop Areas for Harvest 2019 |
|||
| ‘000 hectares |
DEFRA June Survey 2018 |
EBS Forecast Harvest 2019 |
% Y on Y change |
| All Wheat |
1,797 |
1,864 |
4% |
| Winter Barley |
394 |
444 |
13% |
| Spring barley |
762 |
735 |
-3% |
| Oats |
174 |
190 |
9% |
| Other Cereals * |
51 |
38 |
-25% |
| OSR |
601 |
582 |
-3% |
| Other Oilseeds ** |
27 |
19 |
-28% |
| Pulses |
199 |
183 |
-8% |
| Arable fallow |
269 |
228 |
-15% |
| Other Crops on arable land *** |
716 |
702 |
-2% |
| TOTAL |
4,990 |
4,986 |
|
| Source: The Andersons Centre/AHDB, Defra
*crops included rye, corn and triticale **crops included linseed and borage ***crops included s. beet, potatoes, vegetables, Maize (33%) and temp grass (20%) |
|||
Good conditions and higher prices in the autumn typically see more winter cropping, which has been evident this year. The wheat area is forecast to rise by 4%, to 1,864,000 hectares. If this is correct it will be the highest wheat area since 2014 and will be 28,000 hectares more than the past five-year average. For similar reasons, the winter barley area is also expected to see a considerable rise in area, by 13%. In contrast the spring barley area is forecast to decline by 3%. This will be the first reduction since 2014 if correct.
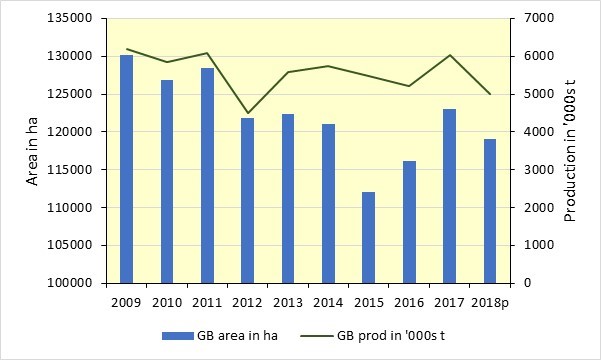
The oat area continues to rise. After seeing a considerable increase in 2018, is expected to rise by a further 9% to 190,000 hectares in 2019. This will mean the oat area has risen by just under 50% since 2015. Oats now appear to be seen as a suitable break crop to substitute for OSR in the rotation. New spring varieties are liked by millers and are also good from a grass weed perspective. In addition, oats, like other combinable crops, have increased in value over the past year, meaning they are now being considered more seriously especially as the profitability of pulses declines.
The harvested area of OSR is expected to decline by 3%. Anecdotal evidence and seed sales actually suggest the area planted was similar or even higher than last year, but dry conditions affected germination and flea beetle attack means the harvested area is forecast to decline. Pulses are also expected to experience a fall in area by 8%; similar to last year. Last year’s disappointing crop will have discouraged producers from growing again this year, but the reduced yield also means there is a seed availability issue, meaning growers have had to find an alternative crop.
The survey is carried out over the first couple of weeks in November and has in the past been an accurate result of the areas harvested. Over the last two years the area surveyed has more than doubled to almost 570,000 hectares. Final results, including regional breakdowns will be released once Defra releases its final results for 2018; this is expected in December.