Somewhat bucking the overall trend is the industry giant, Arla (see previous article). The Coop has announced it will be cutting its prices from 1st July by 0.63ppl. This takes its standard manufacturing litre from 29.89ppl to 29.26ppl (including bonuses for farm standards and climate change).
Category: Dairy & Livestock
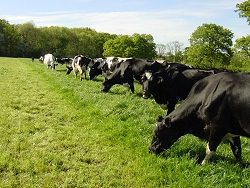
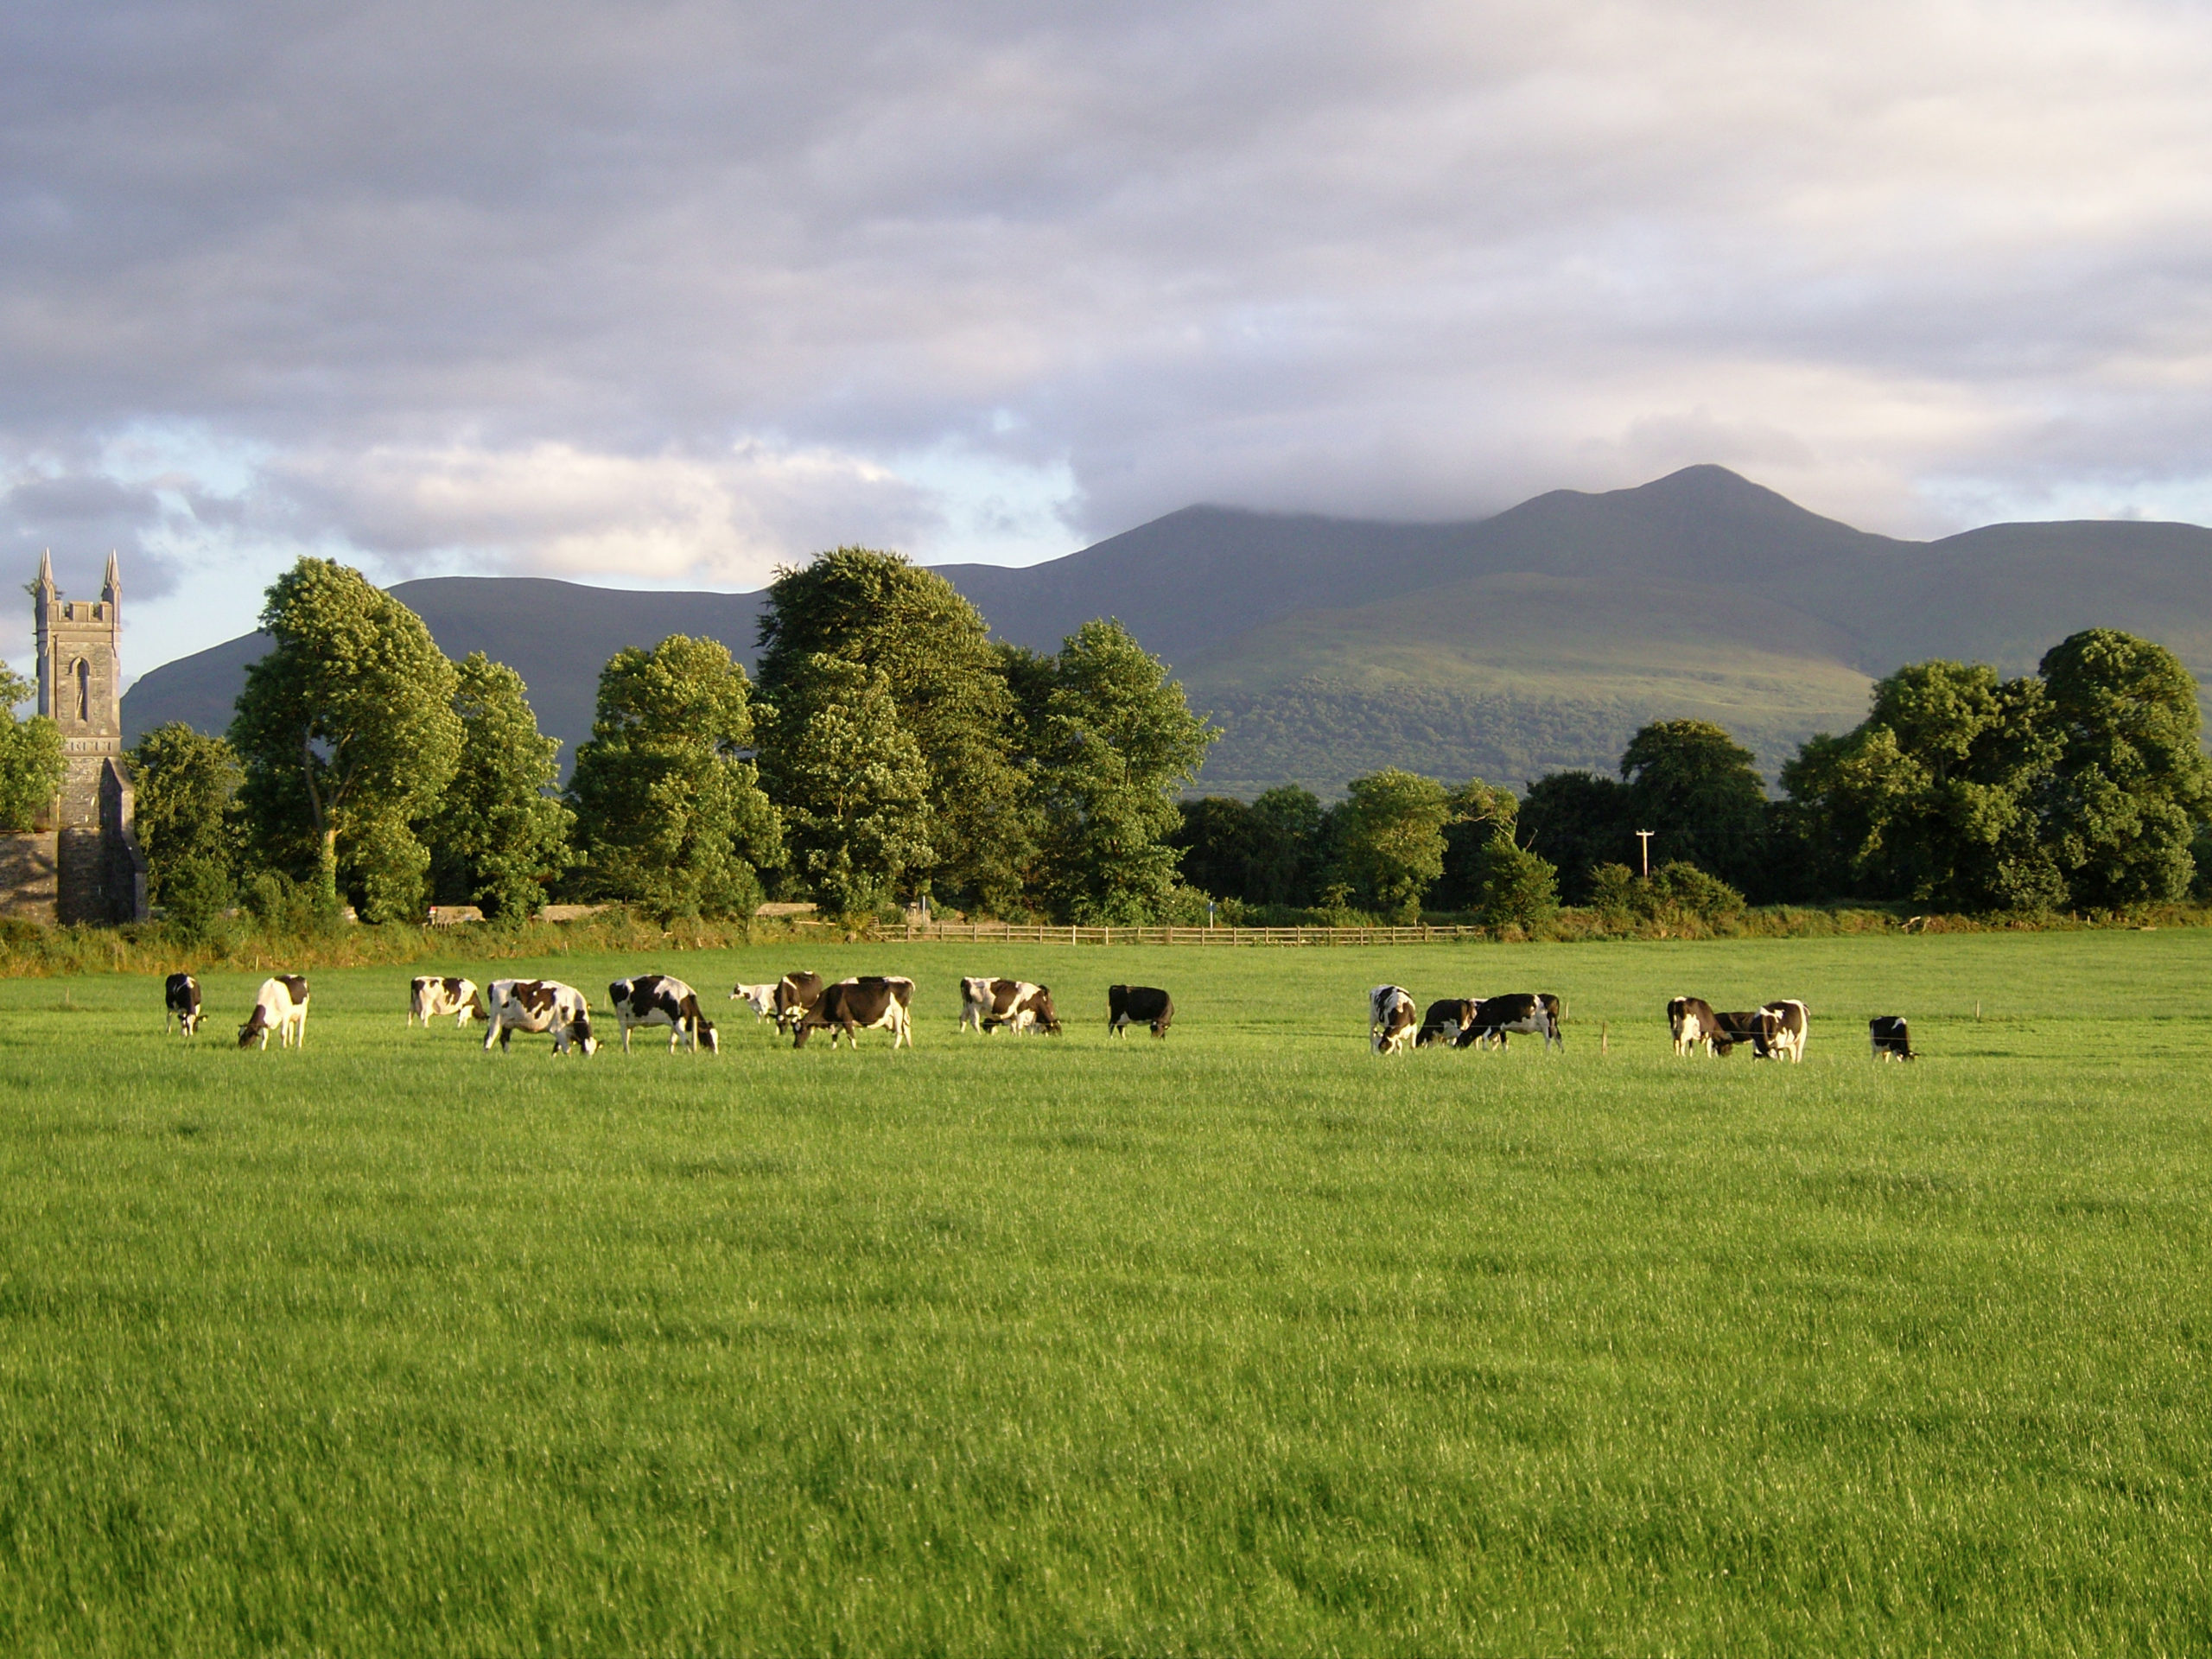
Beef & Lamb Market
The finished beef price has made significant gains over the last 6 weeks. After hitting a ‘lock-down low’ at the end of April of 323p per kg, the all steer deadweight price has risen by over 35p per kg to 358p per kg for the week ending 13th June. In 2019, the price plummeted in June; this year, in contrast, the price is seeing significant week-on-week improvement and is now about 19p per kg above last year. The R4L steer and heifer prices for the same week are 372p per kg and 371p per kg respectively; this demonstrates the price benefit of selling cattle at the correct specification. Cow and young bull prices have also seen strong gains.
The increase has been driven by strong supermarket promotion of prime cuts – for example two-for-£7 deals on many steaks. Coupled with the ‘BBQ weather’ seen through the latter part of May and early June, this has boosted consumer demand. Supplies of finished cattle have also been lower than at the same time last year.
The beef price has been lacklustre since the middle of 2019 and it is hoped as the food service sector gradually re-opens after lock-down, increased demand will continue to support prices. But the sector is keeping a close eye on Irish production. Data from HMRC shows in April 2020 beef imports totalled just under 18,000 tonnes, this is 3,200 tonnes less than April 2019. A decline in imports from Ireland was the main contributor to the decrease in imports. However, slaughter restrictions are beginning to ease in Ireland and production is increasing; if this beef enters the UK market we could see downward pressure on domestic prices.
The prime lamb price remains steady. After crashing in late March/early April due to Covid-19, prices recovered in April and May. The New Season Lamb (NSL) SQQ price started well (recording began from 3rd week in May); just over 47p per kg deadweight higher than year-earlier levels. Prices have seen their usual seasonal decline since then, but the GB deadweight NSL SQQ for the week ending June 13th was 493p per kg, just over 41p per kg more than in 2019. The GB liveweight NSL SQQ price fell by almost 20p per kg during the week ending 17th June to 214p per kg. However, prices for lambs meeting export specification remained strong. Again, emphasising meeting specification is key.
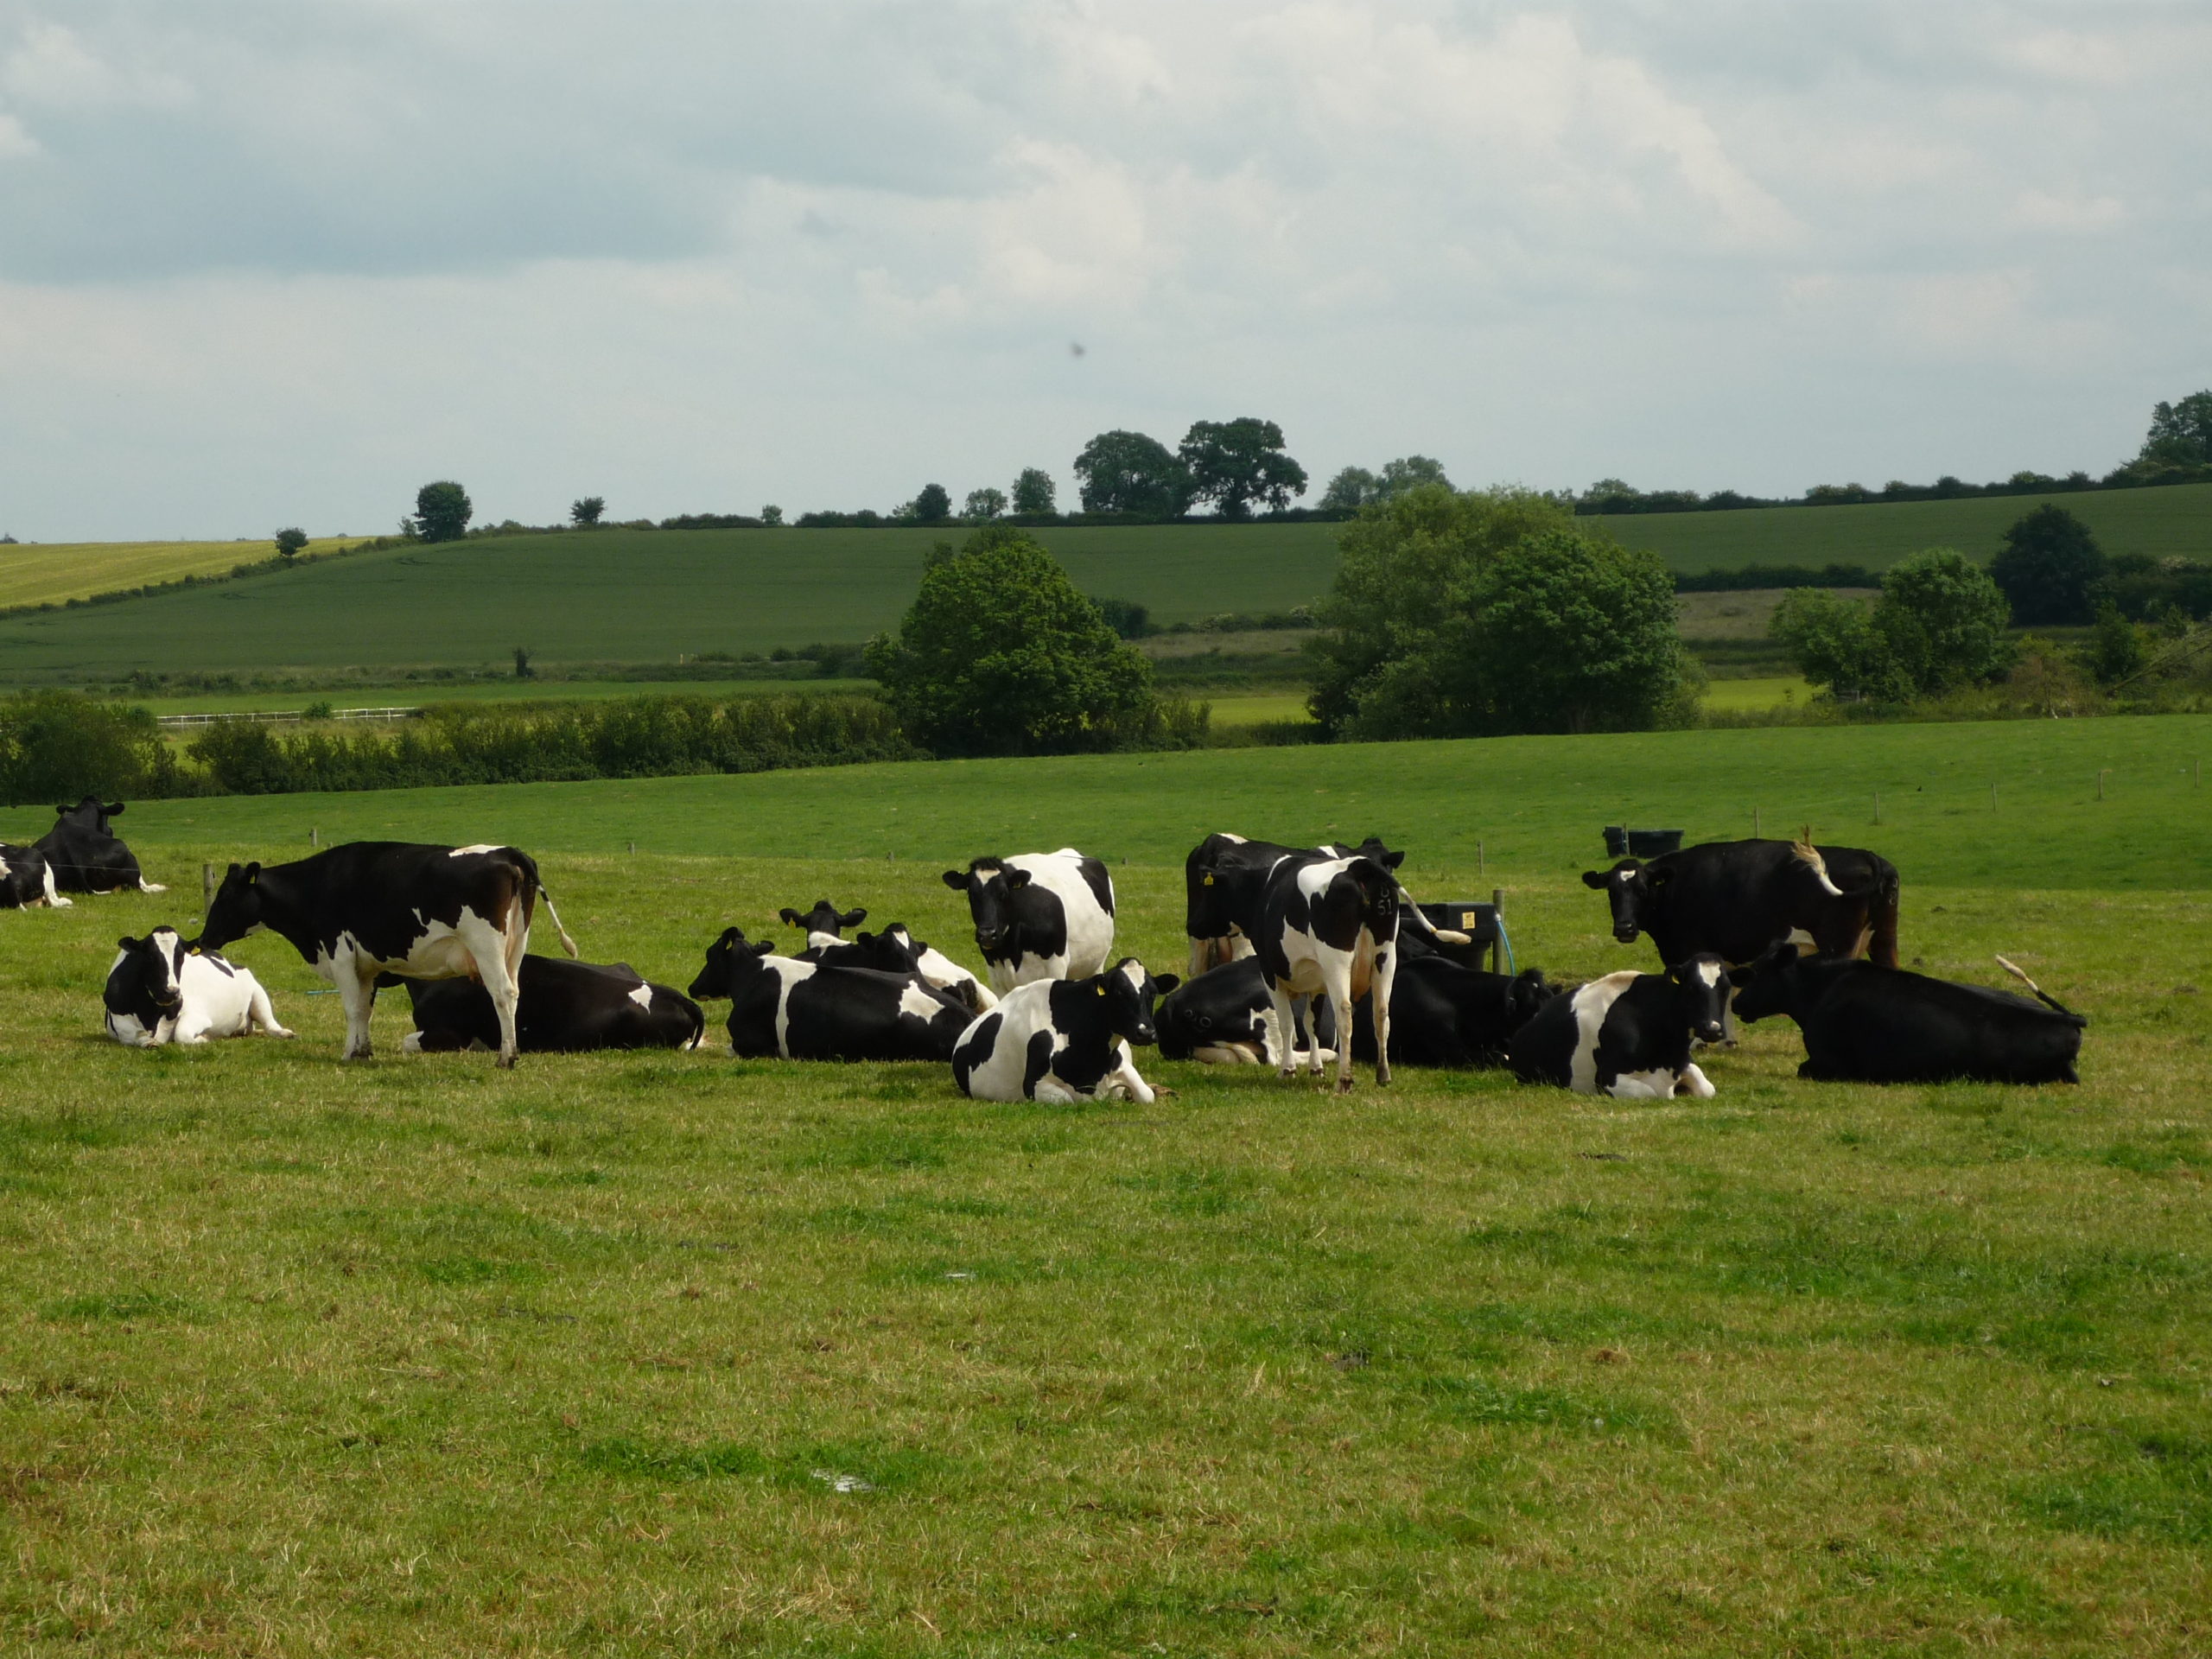
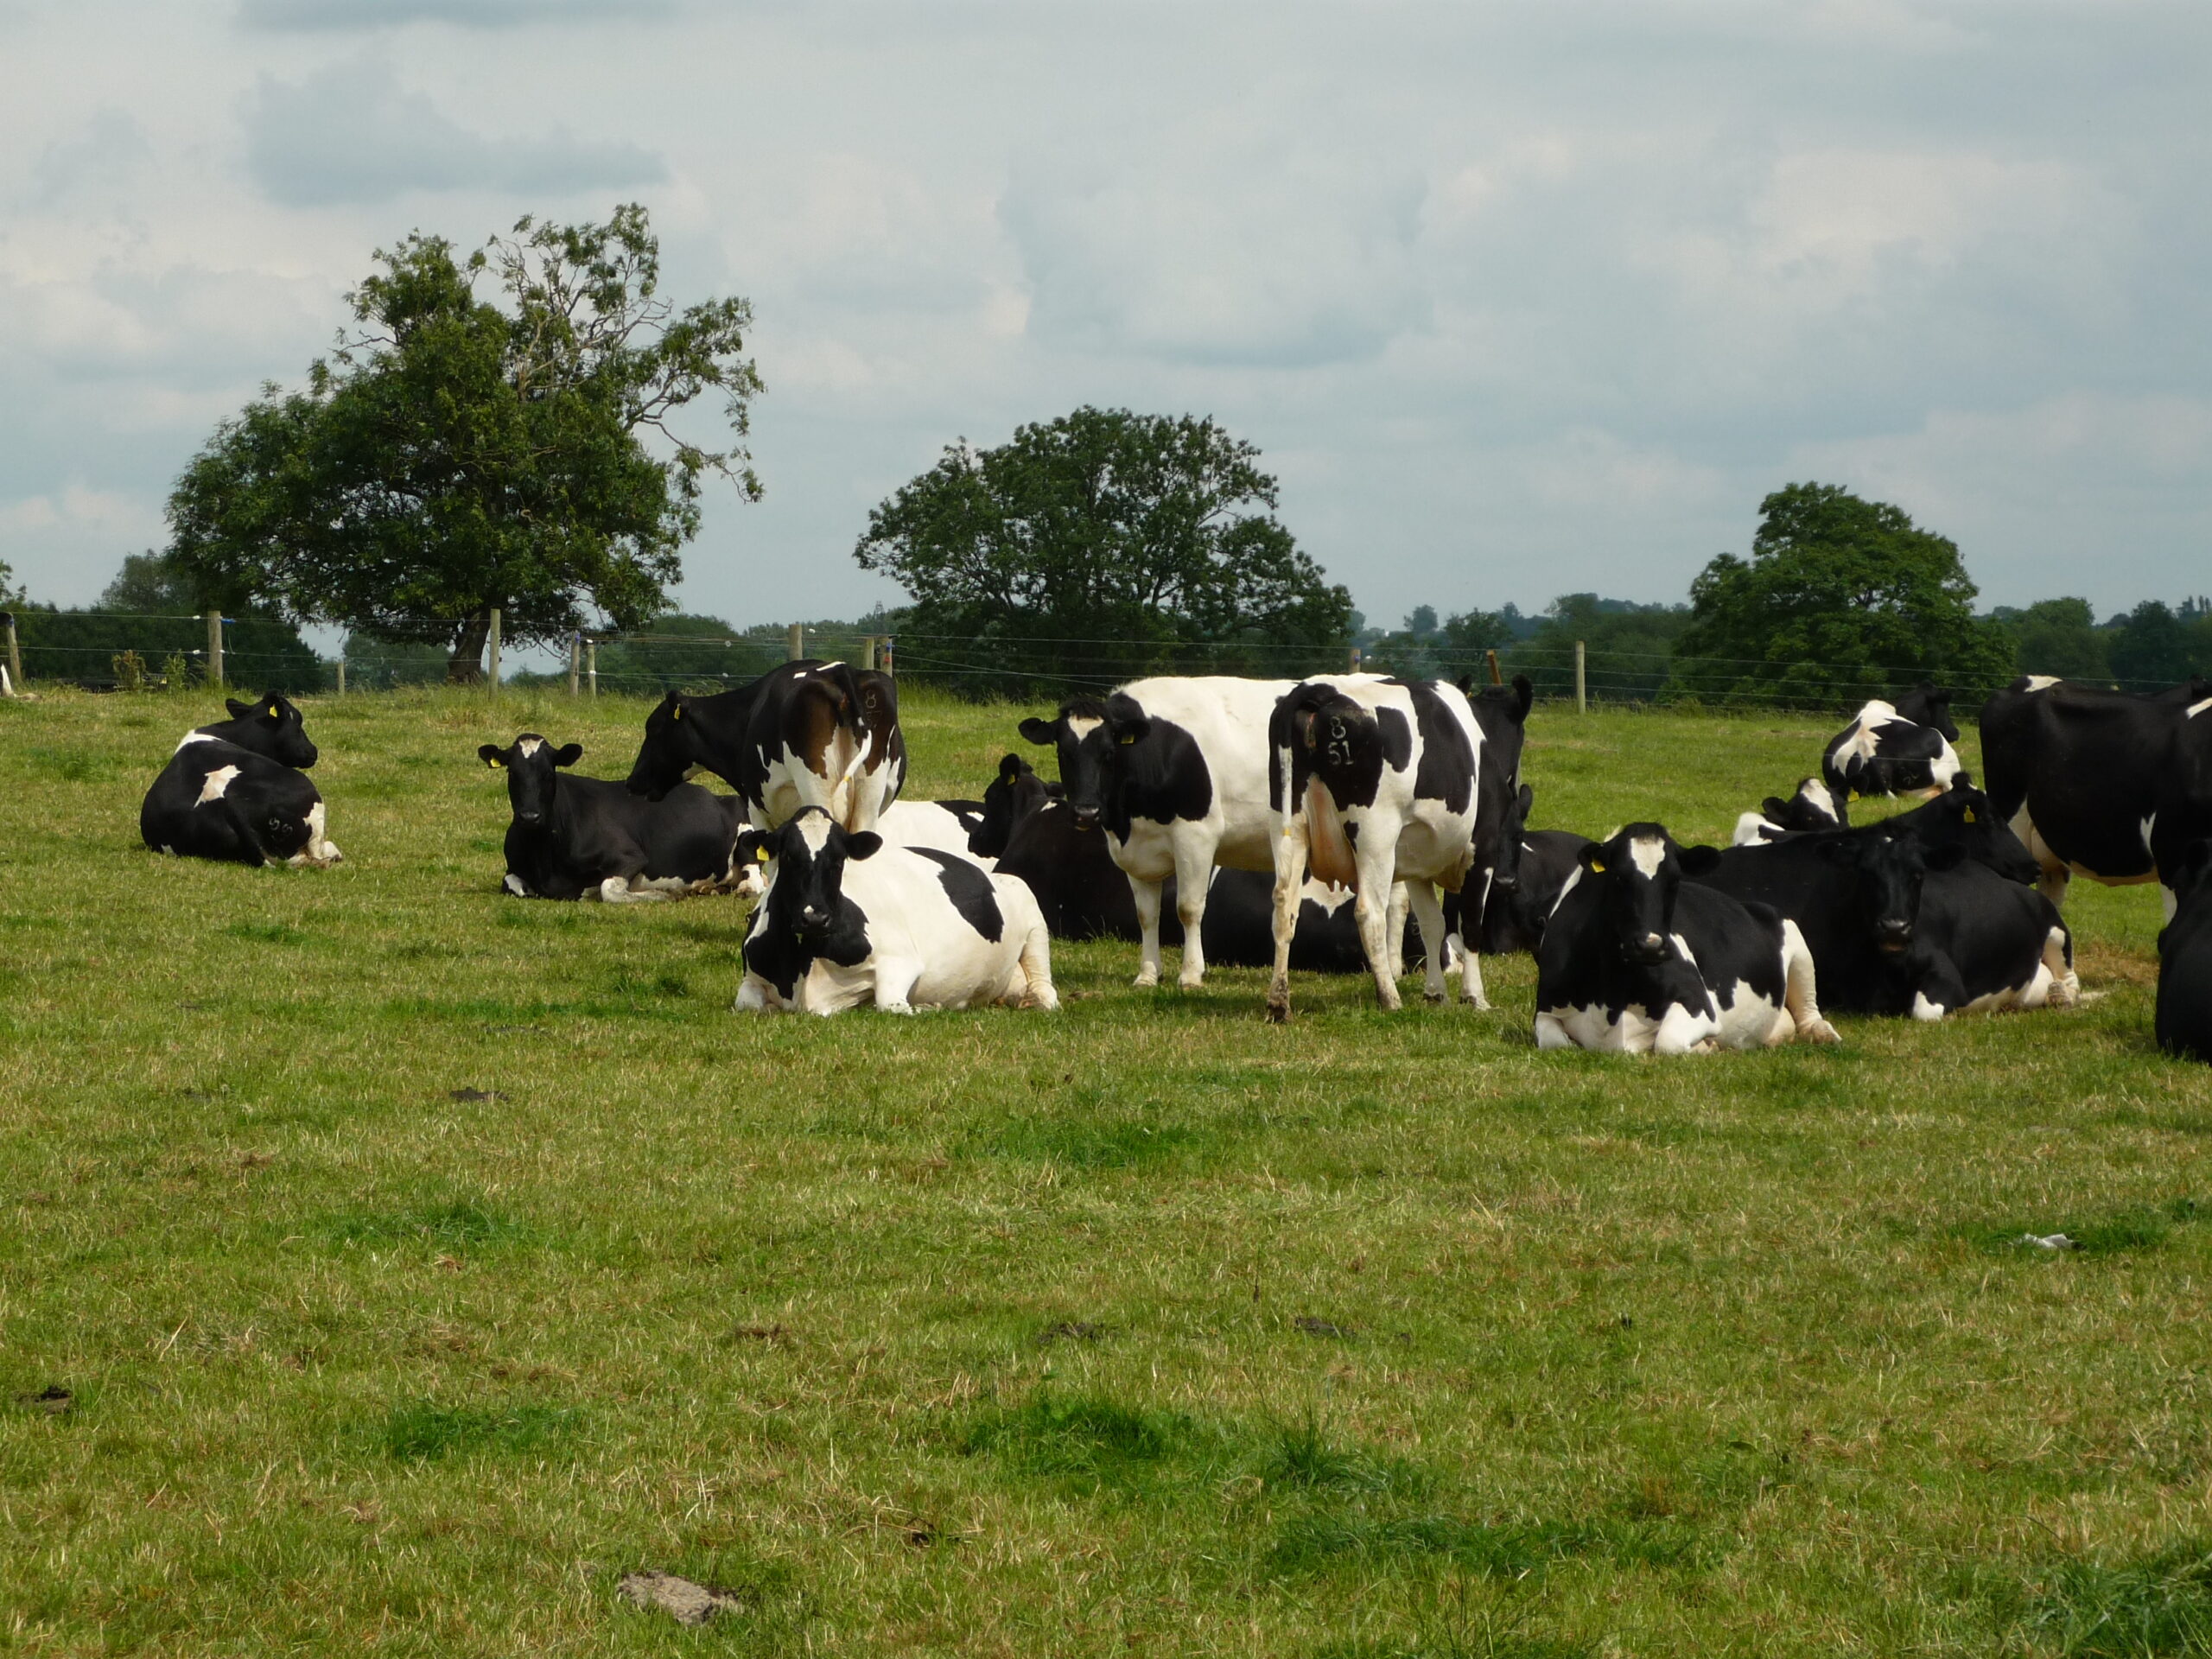
Dairy Update
Milk deliveries are currently running about 1 million litres less per day than expected, due to those who reduced their production in the run up to the peak spring ‘flush’ to alleviate some of the oversupply problems as a result of Covid-19. The AHDB has revised its estimated reduction in Aprils’ production from 23 million litres to 19 million. But for May, it is estimating production was 36 million litres lower than it would have been if dairy farmers had not reacted.
Farmgate prices remain fairly stable and if anything are edging up. Medina, although from a pretty low base, has announced a 1p per litre increase from 15th June and a further 1.5p per litre from 1st July. Graham’s Dairies has also announced a 1p per litre price rise from 1st July. Joseph Heler, one of the only processors to make a reduction in June (of 1.1ppl) has reversed this with the announcement of a 1.1p per litre rise, however this is not until 1st August.
Further afield, the Global Dairy Trade (GDT) average index recorded an increase of 1.9% to $2,979 at the latest event held on 16th June. All products saw an increase except for butter;
- SMP +3.1%
- WMP +2.2%
- Cheddar +1.4%
- Butter -1.0%
Dairy Support
The Dairy Response Fund 2020 opened for applications on 18th June. Readers will recall this is in response to challenges the dairy sector has faced due to Covid-19. To be eligible producers must;
- supply cows’ milk to a wholesale purchaser (direct sellers of cows milk or milk products and producers of buffalo, sheep or goats’ milk are not eligible), and
- had a reduction in the average price paid for their milk of 25% or more in April 2020 compared to that paid in February 2020 (calculated by comparing the average base price before any additions – i.e. butterfat, protein or volume bonus or any deductions for levy, SCC, bactoscan or antibiotics)
Eligible applicants will need to complete a Dairy Response Fund 2020 application form and email it to [email protected] together with milk statements for February, April and May. There will be a one off payment of up to £10,000 to cover 70% of income losses in April and May. Payments will commence from 6th July. Applications must be received from an email address registered with the Rural Payments Service by midnight on 14th August. Forms and further guidance can be found at https://www.gov.uk/government/publications/dairy-response-fund-2020?utm_source=7e19c820-b161-46e2-90d8-070ddcd21f42&utm_medium=email&utm_campaign=govuk-notifications&utm_content=immediate

Dairy Funding
Dairy farmers in England and Wales will be able to apply for Corona hardship funding from 18th June.
In England, to access the ‘Dairy Response Fund’ farmers will need to show that their average milk price in April was 25% lower than that in February. There will be a one-off payment of up to £10,000 to cover 70% of income losses during April and May. Further details of the application process are expected over the next fortnight. Payments are expected to commence from the 6th July. The NFU has criticised details of the scheme – pointing out that many producers on A and B contracts will have sharply reduced production of B litres because the price was so poor. This might mean their average price has not dropped by over 25%, but they still face significant income falls.
In Wales, the Dairy Support Scheme will be very similar – providing up to £10,000 to cover 70% of lost income in April and May compared to February 2020. Farmers will, again, have to show a reduction of 25% or more in the average milk price and will be required to provide their Milk Statement covering February, April and May 2020. Payments should be made within 10 days and the scheme closes on 14th August 2020. See https://gov.wales/welsh-dairy-support-scheme-set-open-applications .
Dairy Round-up
Markets
In the latest Global Dairy Trade event on 19th May the average price index rose by 1% to $2,907 per tonne. This is the first increase since the end of January, apart from a 1.2% in early April. It was mainly due to a 6.7% increase in the SMP price. WMP, butter and cheddar all saw losses of 0.5%, 1.9% and 6% respectively.
Closer to home, reports suggest markets are improving as the lockdown begins to ease on the Continent and, to a lesser extent, at home. Increasing demand and the opening of Private Storage Aid (PSA) (see below) has seen the price of butter increase, this in turn has supported the cream price. The spot milk price has also improved to about 18-20ppl as producers manage production and some areas of the country are reportedly now past the spring peak.
Farmgate Prices
Many processors have held their prices as they watch to see which way markets will go. This includes Muller who, as reported last month, had to quickly rescind the price rise it had announced for May when Covid struck. The processor will also be holding the same price for June. Other processors have also kept their prices unchanged for June include; Barbers, Saputo, South Caernarfon Creameries, Belton Farm (Cheese) and First Milk (Cheese). There has inevitably been some price reductions with Glanbia Cheese and Meadow Foods suppliers’ in Cumbria and South Wales receiving a 2ppl reduction as from 1st May. Other Meadow Foods suppliers received a 1ppl price cut from the beginning of May. Even M&S aligned suppliers will receive a 0.61ppl reduction from 1st June, although its price will still be 31.72ppl and highlights the range of current farmgate prices. The difference between the top aligned and lowest non-aligned contracts is now nearly 10ppl.
Production
Latest figures from the AHDB, show for the week ending 9th May, GB daily milk deliveries were averaging 37.01m litres; up 0.4% on the previous week. But overall production is now about 1.8% behind that of last year. The actions by some farmers to reduce production has prevented the need for milk to be dumped as witnessed at the beginning of April. Reports suggest production was cut by 23m litres during April, helping to keep within processing capacity and avoid excess milk having to be disposed of on farm. While this may have given the industry some breathing space, these farmers will have seen a financial impact on themselves as a result of the cut-back.
Private Storage Aid (PSA)
The EU PSA scheme, which provides financial support for placing dairy products into storage, opened for applications on 7th May. As the UK is still in the Transition Period it is allowed to use the scheme. Limits have been put on the amount of cheese each member state can put into storage. The UK along with Ireland, Italy and Sweden have all used their allocation for cheese already; the UK used its within a week.
Dairy Campaign
The AHDB, Dairy UK, Defra and the other devolved farming administrations have all come together to fund a £1m dairy industry marketing campaign. The ‘Milk Your Moments’ initiative aims to increase consumption of milk and other dairy products by encouraging consumers to celebrate and record moments we used to take for granted before Coronarvirus – such as simply having a cup of tea or coffee with friends. These can then be shared across all the digital platforms and social media. Consumers will also be prompted to visit the ‘Milk Your Moments’ website which will generate a random ‘moment of inspiration’ and for each one will donate £1, to the mental health charity ‘Mind’.
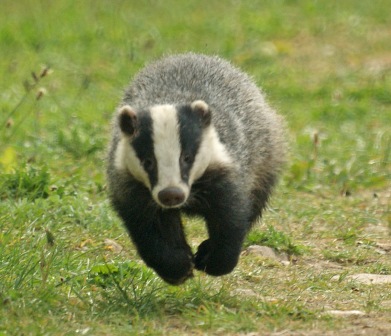
Bovine TB
Consultation
Defra has launched a consultation on managing both vaccination and culling of badgers in the Edge Area. The aim is to reduce the risk of culling already-vaccinated badgers, balanced with allowing culling to continue where applications meet the licensing requirements. The proposals would see badgers within active vaccination sites in the Edge Area protected from adjacent culling through the use of no-cull zones surrounding the vaccination sites. The proposals include minimum criteria for the no-cull zones, including the size of the zones to ensure they are proportionate to the size of the vaccination area, to minimise any reduction in disease control that the zones may cause. In response to the Godfray Review, the Government set out its ambition to move away from widespread badger culling to wider deployment of vaccination.
The full consultation can be found at https://consult.defra.gov.uk/animal-health-and-welfare/badger-no-cull-zones-edge-area/ Responses need to be made by 26th June.
Culling Areas
Natural England has licensed and authorised seven new supplementary badger control areas to begin operations in 2020. These include two areas in Cornwall, two in Devon and one in each of the counties of Dorset, Gloucestershire and Herefordshire. In addition, it has authorised the resumption of operations in three existing areas in Dorset (year 2), Somerset (year 4) and Gloucestershire (year 4).
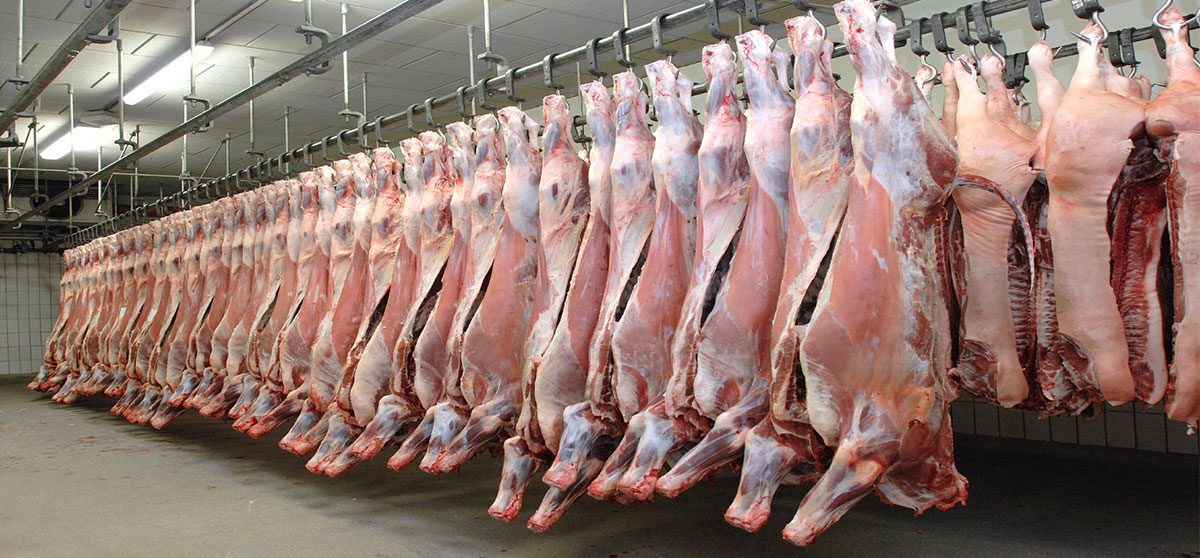
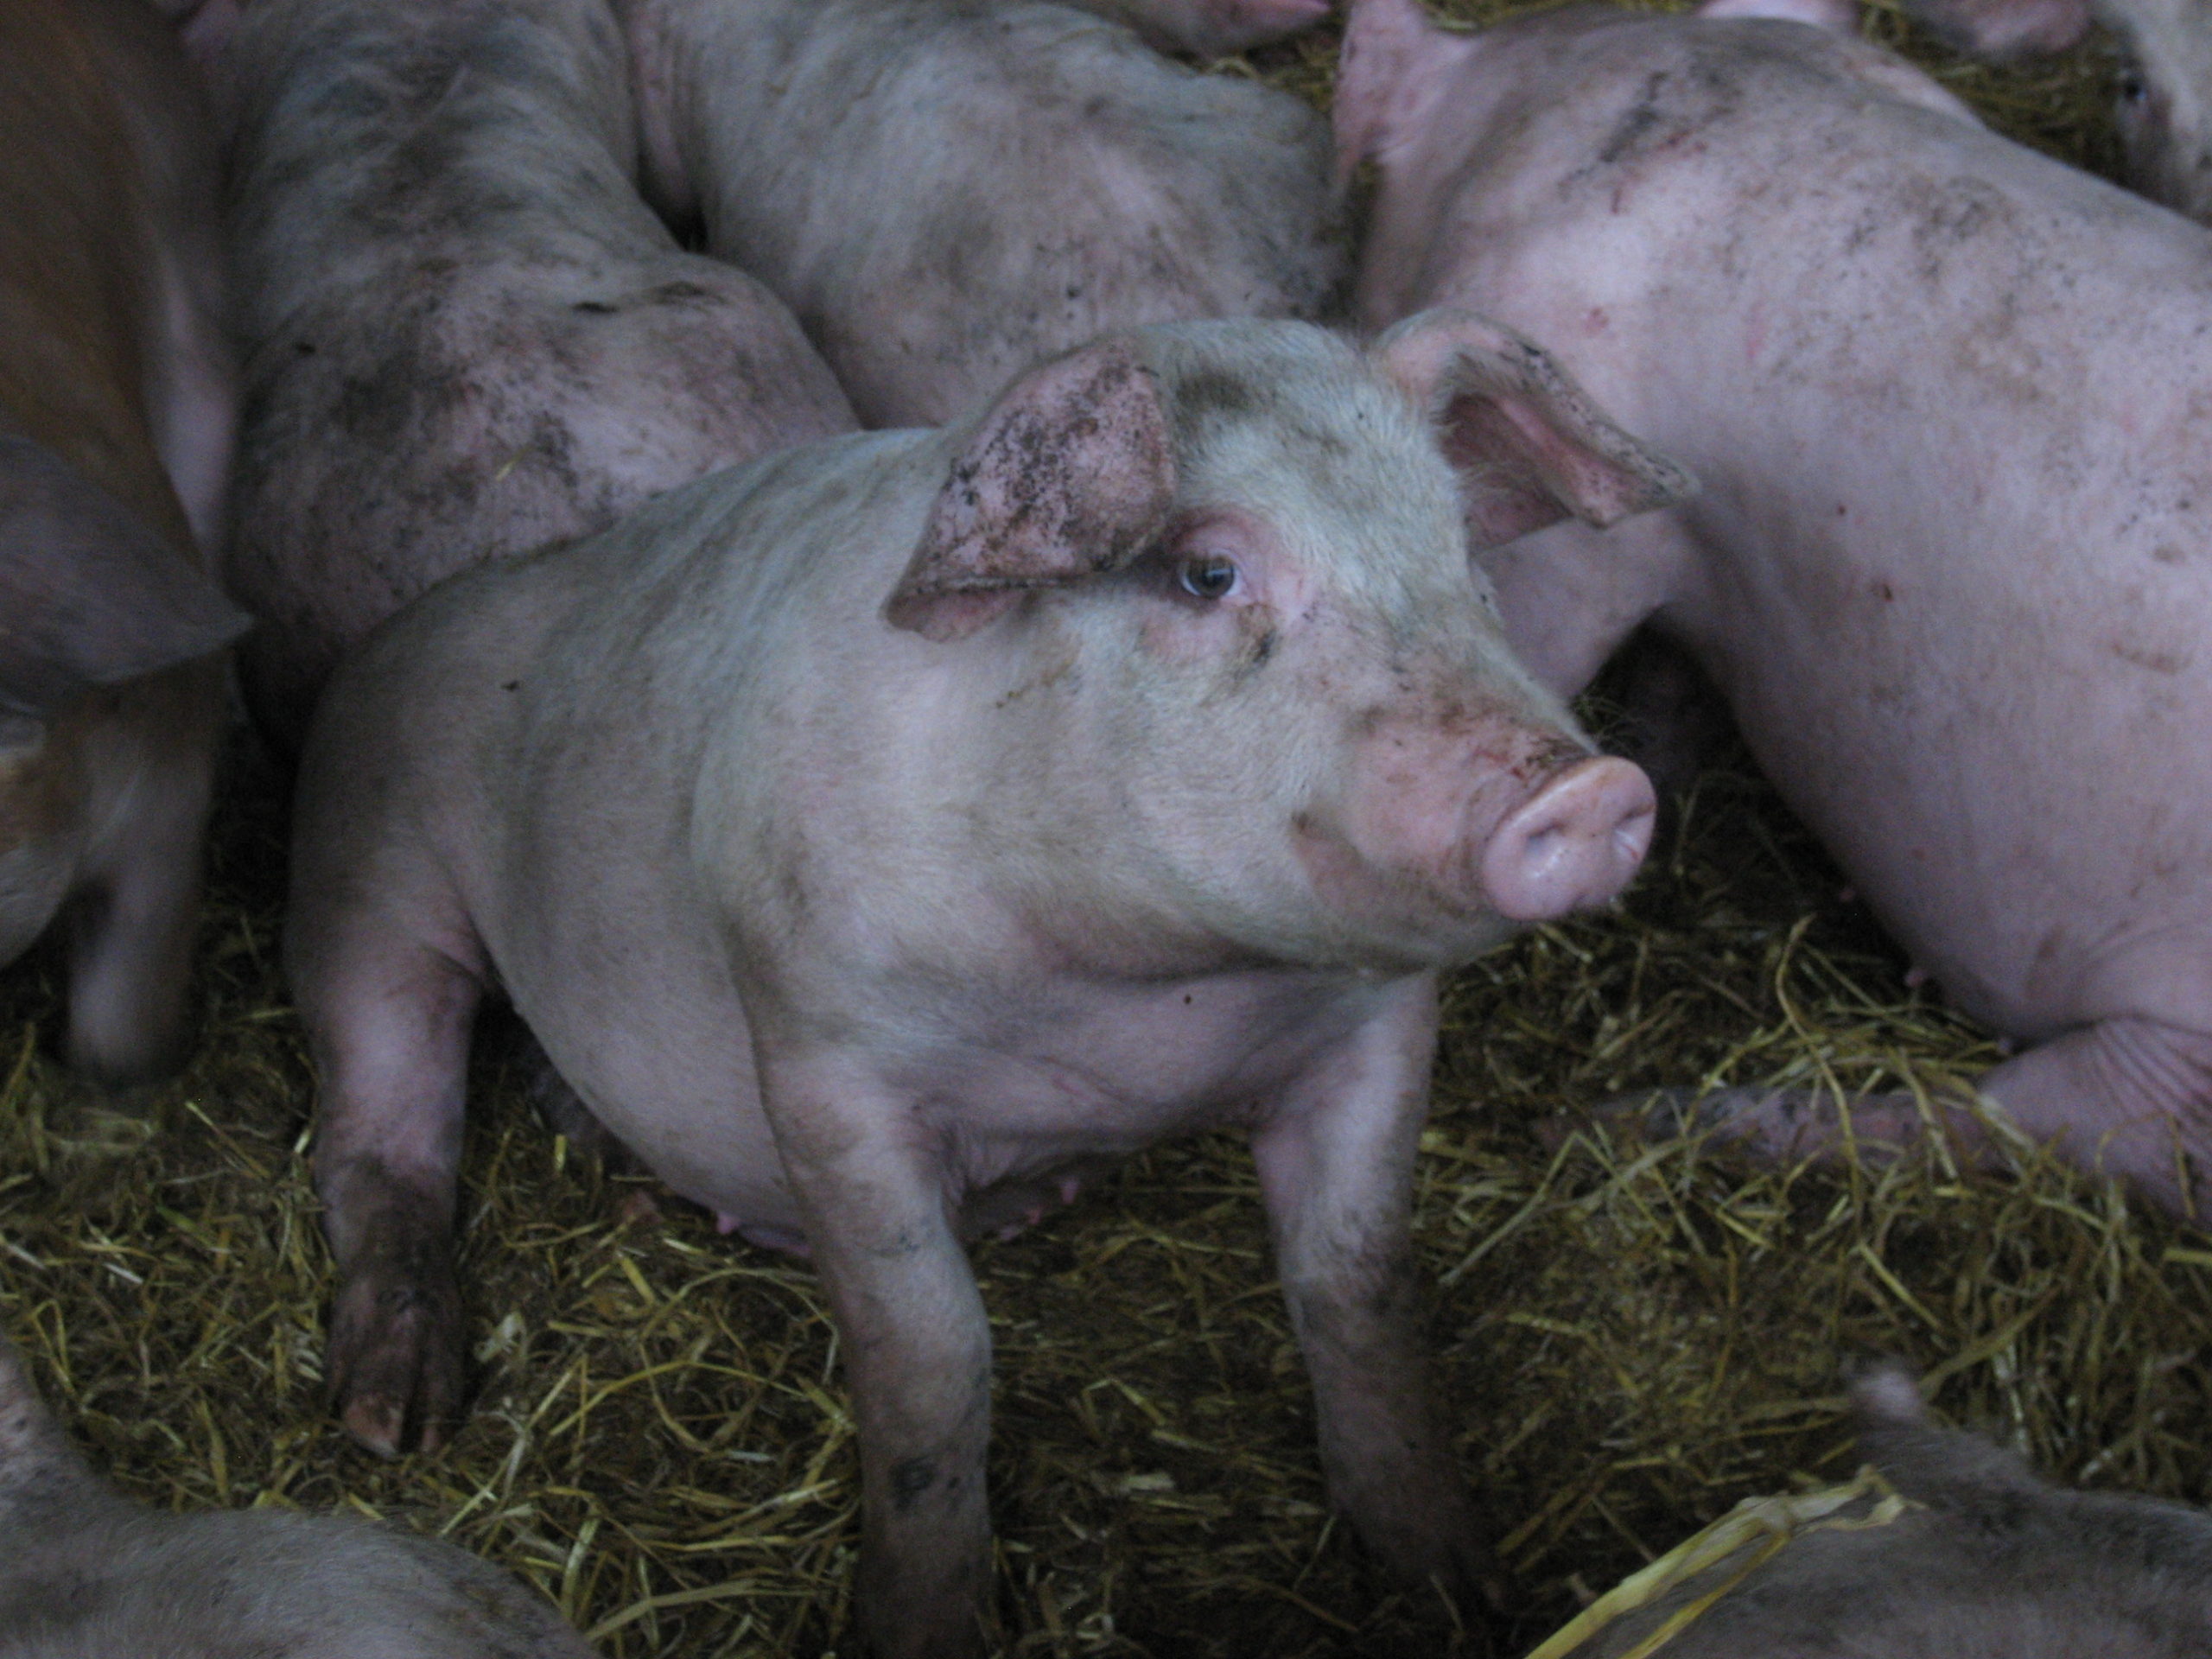
Pig Meat Market
The GB finished pig price does not, so far, look like it has been severely affected by the Covid 19 pandemic. However, with values on the continent falling sharply, will this remain the case?
GB prices have remained firm through May with the EU-spec SPP being 164.34ppkg in the week ending 16th. This is around 20p higher than the same point last year and 25p above the five year average. Reports suggest demand remains steady. Some processors are reporting disruptions due to Covid 19 which could affect processing capabilities in the short term. Estimated slaughter numbers are 15% down compared to the same week in 2019 and 11% less than the five year average. Whilst this helps stem any over-supply issues in the short-term, finished pigs may currently be held back – storing up issues for the future. It is also reported that that there are currently plentiful supplies in cold storage. Whilst the GB market is finely poised, it does seem that supply and demand are currently well balanced.
The picture is quite different in the rest of Europe, with some of the main producers of pig meat finding the market over the last few weeks increasingly challenging as the lockdown measures affect demand. Germany, Denmark, the Netherlands, Spain, Italy and Poland have all seen their pig meat prices fall sharply during the pandemic. In Ireland, just two sites are responsible for more than half of the pig slaughter. The worry is if a Covid 19 outbreak occurred in either of these sites, affecting processing capability, there would be a significant supply chain issue. The ‘lockdown’ is starting to ease in most countries now, but with social distancing required in restaurants, the holiday season disrupted, and staffing levels in processing plants still affected, it remains to be seen how much the ‘ease’ supports demand and whether there will be a knock-on effect on GB prices.
Welsh Dairy Support Scheme
The Welsh Government has announced a scheme to support dairy farmers affected by the Covid-19 crisis. It is largely the same as the one already outlined for England – dairy farmers who have lost more than 25% of their income in April and May will be entitled to up to £10,000 to cover 70% of their losses. Further details of the scheme including how to apply are expected shortly. It will now been seen whether Scotland also introduces such a scheme.
Dairy Farm Covid Support
Following intense lobbying, the Government has announced further support for dairy farmers affected by the Covid-19 outbreak. Businesses which have seen their income drop by more than 25% during April and May will be able to claim under the scheme. The support will be equal to 70% of the lost income for these months, up to a maximum of £10,000.
More details on the scheme, including how to apply, are still awaited. The Government announcement can be seen here – https://www.gov.uk/government/news/new-funding-to-support-dairy-farmers-through-coronavirus.
There is also going to be a £1m advertising campaign to persuade the public to consume more milk and milk products – in order to offset the fall in demand caused by the closure of coffee shops, restaurants etc. The campaign is part-funded by the AHDB and partly by the four devolved UK Agricultural Departments.