International Grains Council Figures

The International Grains Council (IGC) has released its first full supply and demand projection for the 2021/22 year.  This shows 63 million tonnes more grain production than last year at 2,287 million tonnes (a 2.8% increase).  Production rises each year because demand does too and the rise in demand of ‘only’ 54 million tonnes simply halts the decline in stock levels.  The level of grain stocks entering the new marketing year is the lowest for four years – this is what is fuelling the global price rises.

The table below demonstrates the figures .

19/20 figures estimates; 20/21 forecasts; 21/22 projections    Argentina, Australia, Canada, EU, Kazakhstan, Russia, Ukraine, US

A small rise in wheat partially offsets the decline in total grains.  This matters in the UK because wheat is the dominant cereal crop.  However, this means the coarse grain decline is greater still.  The figures are marginal at this stage of the year, but it means that the current concerns of continued excessively dry weather, or the arrival of persistent rain in the key grain growing parts of the world could have major swings in the availability of grains for the coming year, and prices accordingly.

IGC Global Crop Predictions

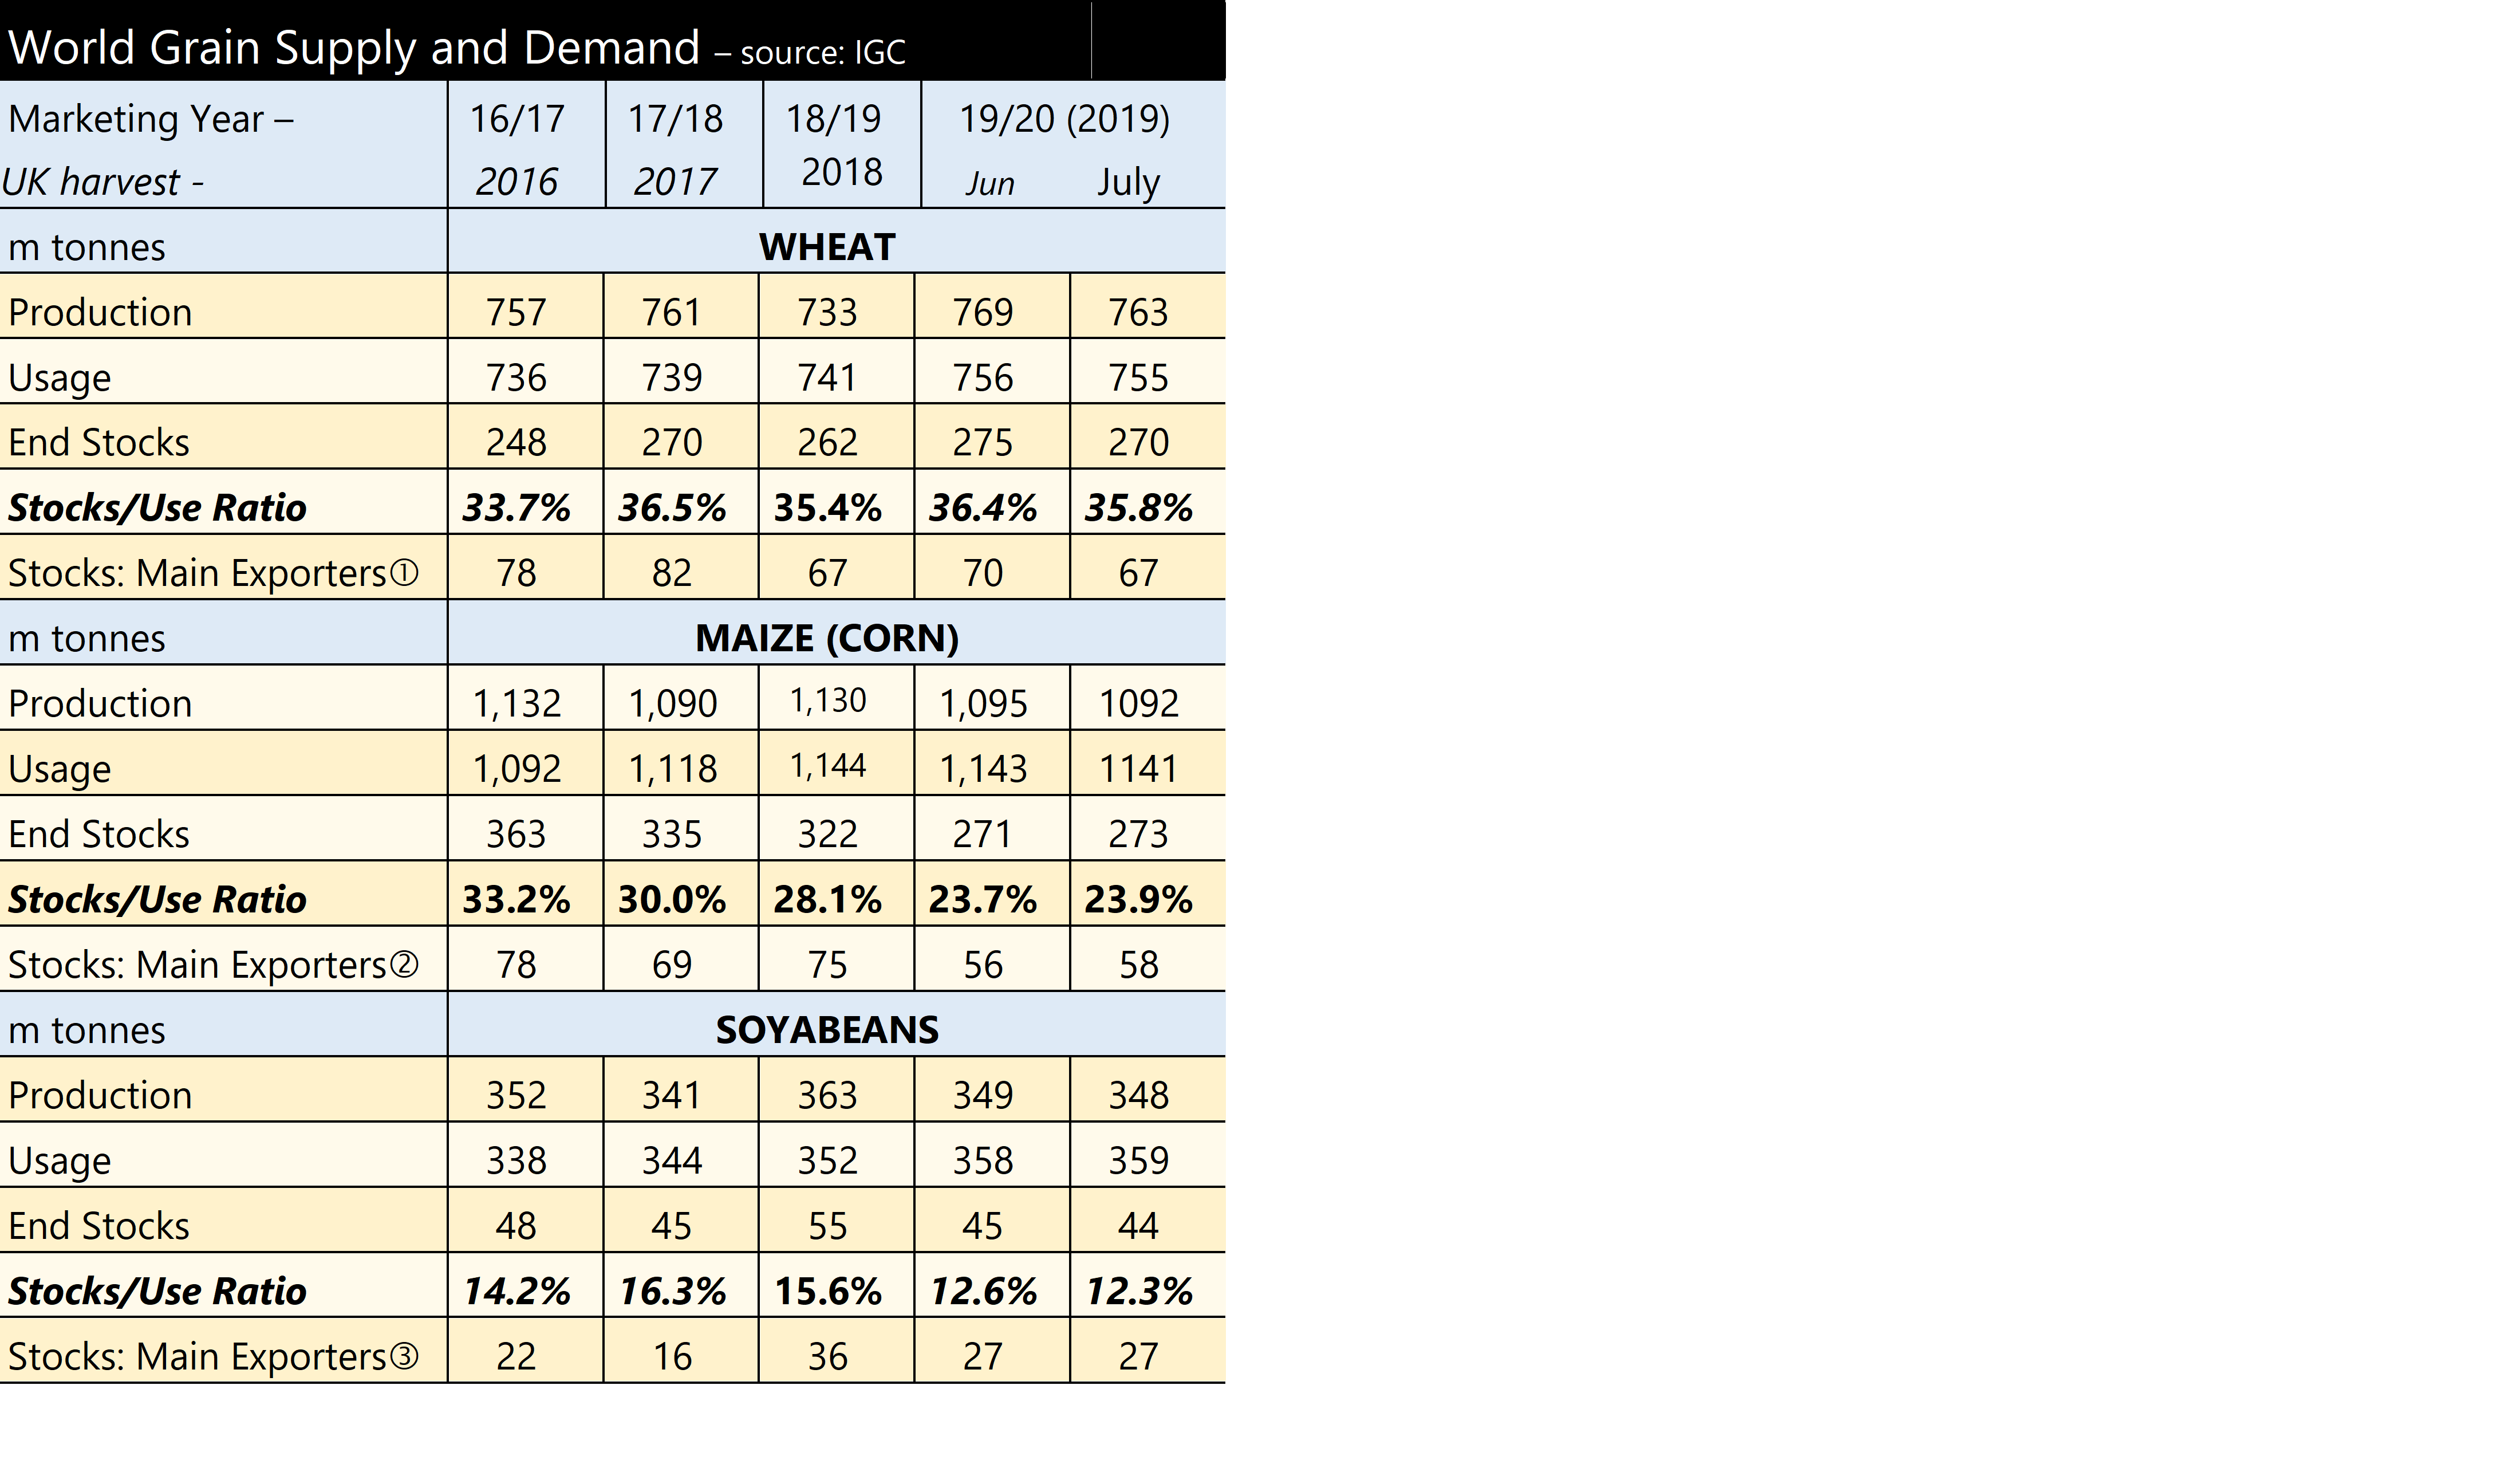
As the northern hemisphere harvest gets underway, the forecasts for global grain output should become more accurate.  The International Grains Council (IGC) released an updated forecast at the end of July which is summarised in the table below.

Wheat stocks are expected to rise according to the IGC to levels of 2018/19, or in terms of stocks as a proportion of usage, no real change from last year.  However, from last month to this, the harvest expectations have declined slightly, making the stock level more akin to last year. A fall of 5 million tonnes from one month to another sounds like quite a lot but at this time of year when the crop is being gathered, it is minimal and of little impact to prices.  Consumers are comfortable at the moment that stocks will be available for them of the quality and specification they require.

The same cannot be exactly said of maize, with production thought 35 million tonnes lower than last year; back to the level seen for harvest 2017.  Consumption continues to go up each year, so stocks as a proportion of usage are forecast lower than previous years.  The IGC has the stock level falling from 322 million tonnes to 273 million, a decline of nearly 50 million tonnes, or in terms of requirement, from 28% of a year’s requirement to less than 24%.  This was already seen in June, but as we enter harvest, the figures will become more reliable.  Whilst this is a more dramatic fall of stock and supply level than wheat, it is still not at a level that is making the consumers frantic.

Soya production is though unlikely to be as high as last year, also being closer to the previous year, but with consumption gradually rising each year, stocks are seen falling from 15.6% to 12.3%; potentially bullish for the oilseed (and protein) price matrix.

International Grains Council Figures

The International Grains Council (IGC) has released its first full supply and demand projection for the 2019/2020 year, showing 50 million tonnes more grain production than last year with a 34 million tonne rise in consumption.  Consumption goes up every year as we might expect simply as population rises and each person is consuming more than consumers in previous years.  This means that production should be a record each year, simply to keep pace.  However, this coming year, despite production clearly rising faster than demand, the stock level is thought likely to fall.  This is because the stock level was already falling and simply to keep pace, production would have had to rise further.  This is demonstrated in the table.  The level of year-end stock has fallen from over 30% three years ago to 26% now.  This is what has underwritten improvements in grain prices in the last year.  China is ever-increasing its holdings of grain stocks, with over half of wheat and possibly as much as 65% of global maize grains being held in its stores.  This potentially means there is much less grain available than these figures suggest as Chinese stocks are not generally available for the wider market.

All Wheat and Coarse Grain (Million Tonnes)

2016/17

2017/18 2018/19

2019/20

Production

2187

2142 2125

2175

Consumption

2126

2153 2170

2204

Carry over

659

648 604

575

Stock as % of Demand

31%

30% 28%

26%

For wheat specifically, the picture is reversed.  The stock level is seen rising, with a greater rise of wheat production for harvest 2019, resulting in production remaining well ahead of consumption.  In terms of physical tonnes, there was more wheat stock in 2017 but as consumption was lower in those days, the stock level as a percentage of demand was lower.  This is shown in the chart below.

Wheat (Million Tonnes)

2016/17

2017/18 2018/19

2019/20

Production

757

763 735

759

Consumption

735

741 742

752

Carry over

248

271 264

270

Stock as % of Demand

34%

37% 36%

36%

Overall, the figures suggest a strong level of support for grains overall, but there is ample wheat, suggesting the price premium that wheat tends to carry over maize and other feed grains, might be rather slim for a year.